Earthquakes have been in the news lately - in particular, two very strong earthquakes that recently hit California. Exactly where did they hit? ... Let's plot it on a map!
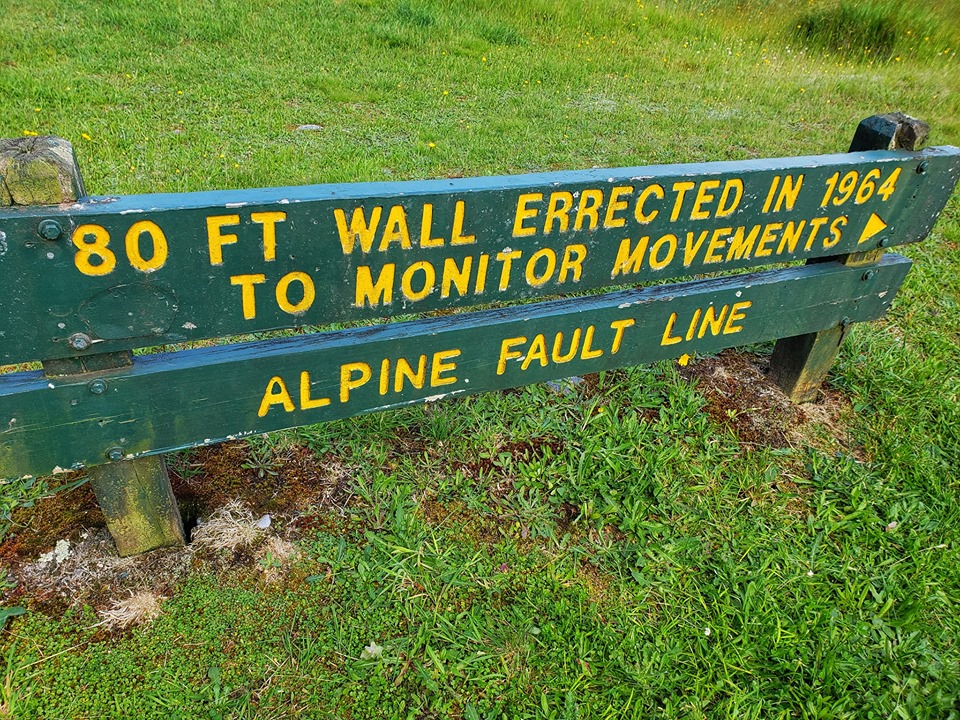
But before we get busy analyzing the California data, here's a picture to get you in the mood for studying things like earthquakes, faults, and tectonic plate movement. This is a photo my friend Eva took while on a trip to to New Zealand's South Island:
Raw Data
Now let's analyze that California data! First I went to the NOAA page that allows me to select and download earthquake data. I specified that I wanted 2019 data for California, as follows:

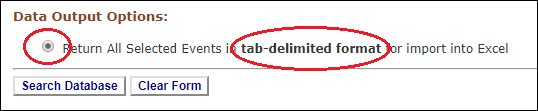
And at the bottom of the form, I selected the box to return the data as a simple text file, with tab-separated columns of data. I clicked the 'Search Database' button, and it downloaded the results in a file called 'results' (which I renamed as california_earthquakes_2019.tsv).
Importing the data
I used the following code to import the data into SAS:
proc import out=quake_data datafile="california_earthquakes_2019.tsv" dbms=tab replace;
datarow=2;
getnames=yes;
guessingrows=all;
run;
All of the date & time values were stored as UTC values. I decided to convert them to local California time. Since all the year/month/day/hour/minute/second values were stored in separate variables, I had to build up strings for the date and time, and create proper SAS date and time variables, and then convert that to local time (in the final step below).
options timezone='America/Los_Angeles';
data quake_data; set quake_data;
datestring=put(month,z2.)||'/'||put(day,z2.)||'/'||trim(left(year));
format date date9.;
date=input(datestring,mmddyy10.);
utc_datetimestring=trim(left(datestring))||':'||
put(hour,z2.)||':'||put(minute,z2.)||':'||put(second,z2.);
format utc_datetime datetime.;
utc_datetime=input(utc_datetimestring,anydtdtm.);
format localdatetime dateampm40.;
localdatetime=tzoneu2s(utc_datetime);
run;
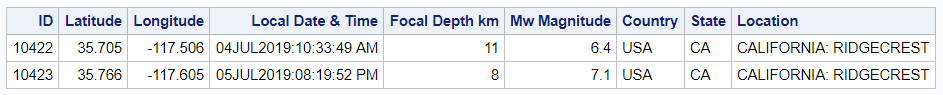
We now have some nice clean data:
Plotting coordinates on a map
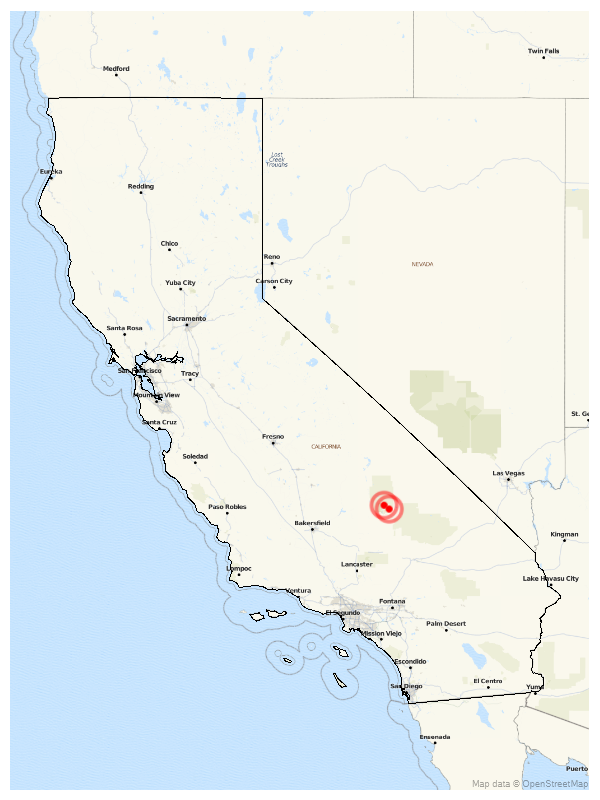
With the new Proc SGmap, it is very simple to plot markers on a map at lat/long coordinates, using minimal code. The following code plots a small solid marker, with a semi-transparent circle around it, on an OpenStreetmap.
proc sgmap plotdata=quake_data noautolegend;
openstreetmap;
scatter x=longitude y=latitude / markerattrs=(symbol=circlefilled size=6pt color='red');
scatter x=longitude y=latitude / markerattrs=(symbol=circle size=25pt color='red') transparency=.5;
run;
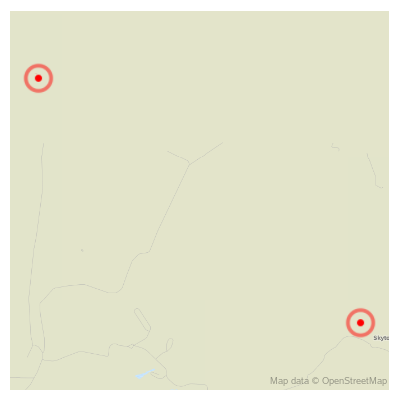
SGmap automatically 'zooms in' on the smallest area that contains all the lat/long coordinates being plotted. In this particular case, both earthquakes are very close together, and therefore the map is a very small area - so small, that there aren't really enough surrounding landmarks for most people to recognize the area.
A trick I often use, to make sure the map includes a larger area, or a fixed area, is to also overlay a border outline on the map (such as a country, state, or county outline), as an empty choropleth map. In this case, since I'm interested in California earthquakes, I overlay the state outline of California.
data state_outline; set mapsgfk.us_states (where=(statecode='CA'));
run;
proc sgmap plotdata=quake_data noautolegend mapdata=state_outline;
openstreetmap;
choromap / mapid=statecode;
scatter x=longitude y=latitude / markerattrs=(symbol=circlefilled size=6pt color='red');
scatter x=longitude y=latitude / markerattrs=(symbol=circle size=25pt color='red') transparency=.5;
run;
Now I can see where the earthquakes occurred, in relation to the state of California (see the darker outline of California on the map). And the Openstreetmap even shows some cities and roads. But when it comes to data such as earthquakes, I would also like to see an indication of the "lay of the land" - such as mountains and valleys. With SGmap, you can use maps from the ESRI map server, and several of those maps show the kind of terrain detail I want. The code below shows how to use an ESRI map, rather than Openstreetmap. (Here's a link to the complete SAS code used to create all the samples in this blog post.)
title1 color=gray33 height=20pt "Significant California Earthquakes 2019";
proc sgmap plotdata=quake_data noautolegend mapdata=state_outline;
esrimap url="http://services.arcgisonline.com/arcgis/rest/services/World_Street_Map";
choromap / mapid=statecode;
scatter x=longitude y=latitude / markerattrs=(symbol=circlefilled size=6pt color='red');
scatter x=longitude y=latitude / markerattrs=(symbol=circle size=25pt color='red')
transparency=.5;
run;
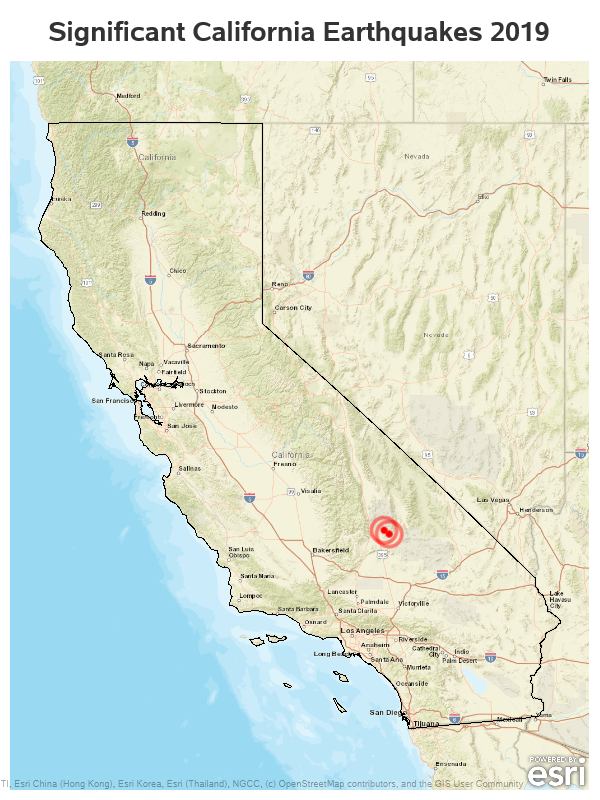
I think including the California state outline, and the mountains & valleys, adds a lot of context to the earthquake data, don't you?!?
And now the big question - are the California earthquakes finished for a while? Or will they have another 'big one' in the near future? Feel free to leave your prediction in the comments section...


2 Comments
UNAVCO's network of 78 borehole strainmeters in the Pacific Northwest will have recorded these two earthquakes in spectacular fashion. https://www.unavco.org/data/data.html
Nice! - Thanks for checking in! 🙂